Fine-tune gemma-2-9b and track as an experiment in MLFlow

Data scientists often run a lot of experiments and it’s essential to be sure that the best run won’t be lost in numerous experiments. MLFlow helps to track experiments, datasets, metrics, and other data. GKE clusters can provide a lot of resources on demand.
The tutorial overview
In this tutorial we will fine-tune gemma-2-9b using LoRA as an experiment in MLFlow. We will deploy MLFlow on a GKE cluster and set up MLFlow to store artifacts inside a GCS bucket. In the end, we will deploy a fine-tuned model using KServe.
Before you begin
Ensure you have a GCP project with a billing account. Enable the following APIs for your project:
Ensure you have the following tools installed on your workstation:
gcloud CLI
kubectl
terraform
helm
git
If you previously installed the gcloud CLI, get the latest version by running gcloud components update
Set up
If you don’t have a GCP project, you have to create one. Ensure that your project has access to GKE.
Clone the repository with our guides and cd to the llamaindex/rag directory by running these commands:
git clone https://github.com/ai-on-gke/tutorials-and-examples.git
cd tutorials-and-examples/mlflow/finetune-gemma
Run these commands to authenticate:
gcloud auth login
gcloud auth application-default login
Enter the terraform-gke-cluster folder
cd terraform-gke-cluster
and adjust in the example_environments.tfvars file the following variables:
project_id– your GCP project id.project_number– your GCP project number.cluster_name– any name for your cluster.gcs_bucket– your unique name for a GCS bucket.
Run these commands to create your GKE cluster:
terraform init
terraform plan -var-file=example_environment.tfvars  # verify is it okay
terraform apply -var-file=example_environment.tfvars # print 'yes' when asked
After about 10-15 minutes your cluster will be ready to go. When the cluster is ready, run this command to get your GKE cluster access token:
export KUBECONFIG=~/tutorial_gke_access_token.kube
export REGION=us-central1
export PROJECT_ID=<PROJECT_ID>
export CLUSTER_NAME=<CLUSTER_NAME>
gcloud container clusters get-credentials $CLUSTER_NAME --region $REGION --project $PROJECT_ID
The last command connects your current terminal session to the GKE cluster and saves kubectl settings in KUBECONFIG path.
Note: in step 1, the “Knative Serving install guide” actually also includes the steps to install the networking layer, and it actually prefers Kourier over Istio.
Install MLFlow
Go to the mlflow-configuration directory. We will use the helm to install MLFlow.
Since we want to access our model from MLFlow UI and deploy it using KServe easily, we need to specify environment variables for MLFlow so it could use GCS bucket as artifact storage. Go to the Google Cloud Console and create a GCS bucket.
Before installing the MLFlow chart, we need to adjust values.yaml so MLFlow could interact with the GCS bucket. Adjust the following values:
<BUCKET_NAME>– your bucket name.
Install the MLFlow chart:
helm install mlflow community-charts/mlflow --version 0.12.0 -f values.yaml
This chart created some service accounts for our MLFlow (you can view them by running kubectl get serviceaccounts). In particular, mlflow is used by the MLFlow tracking server. Our terraform already gave a permission to this service account to access your bucket.
Let’s check our MLFlow tracking server via UI. We can port forward MLFlow tracking service by running the command below. This process runs in background due to the & sign. You can stop the process by killing it (the PID is printed after running the port-forwarding command).
kubectl port-forward svc/mlflow 8000:5000 &
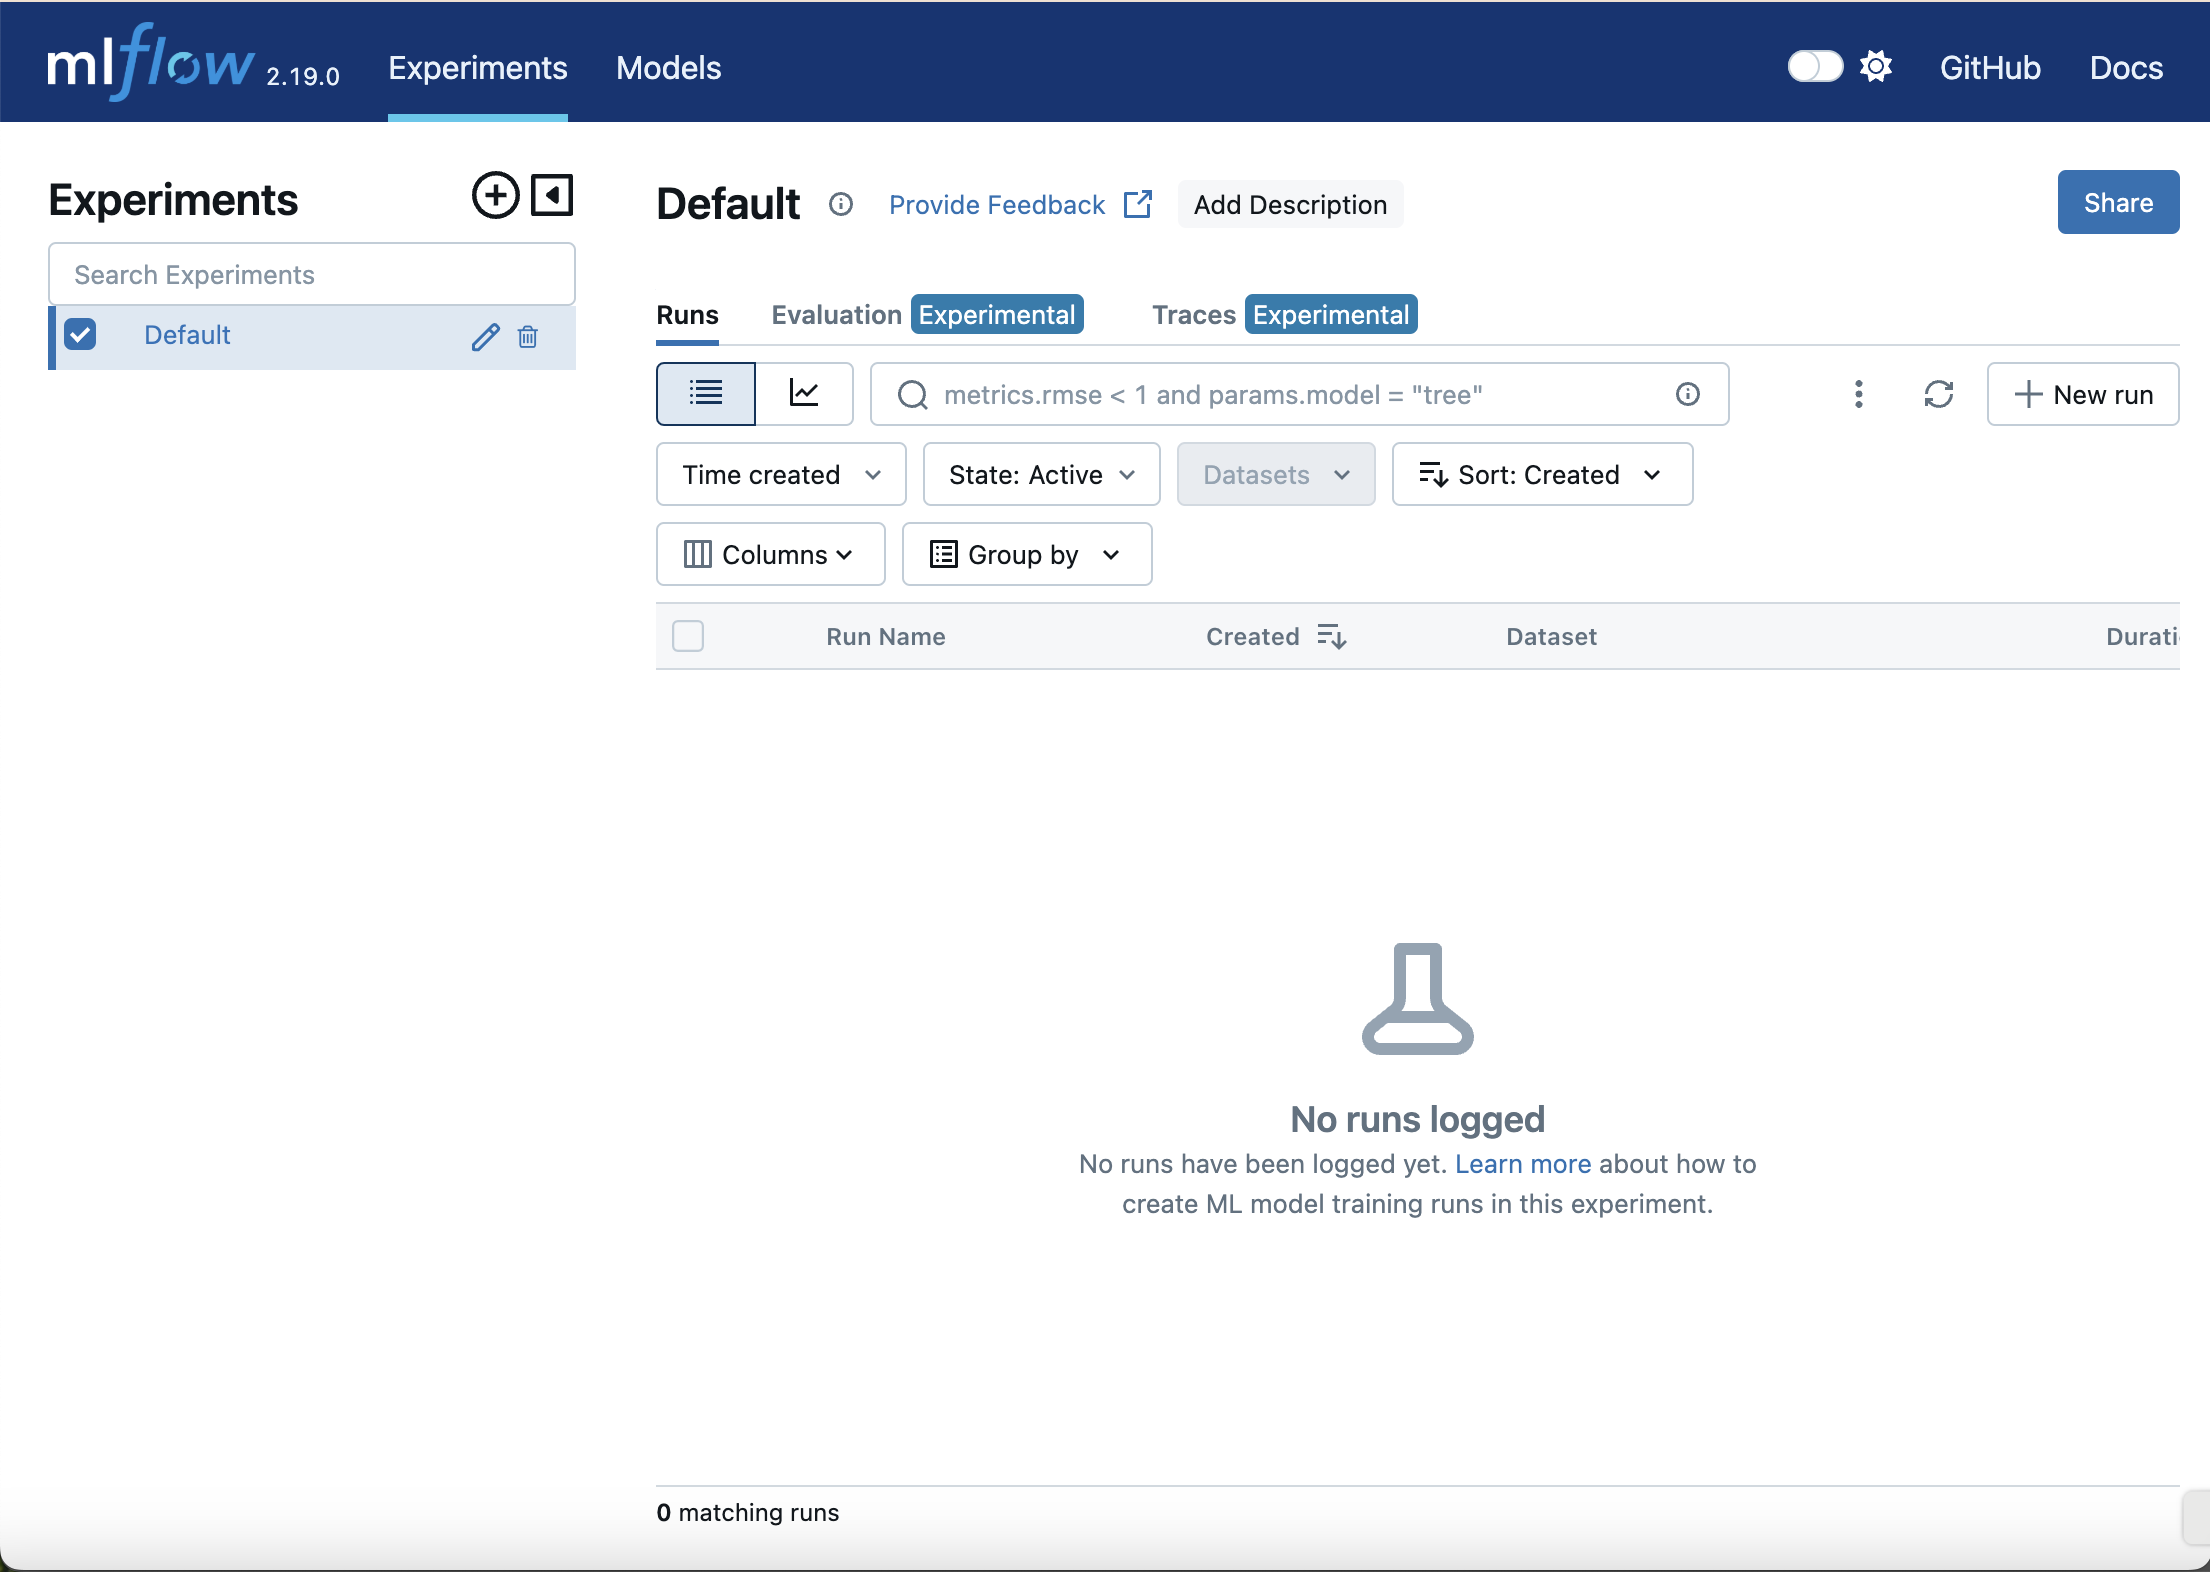
Check your MLFlow UI at http://127.0.0.1:8080. You should be able to see the MLFlow UI like this:
Fine-tune gemma2-9b using LoRA
Go to the finetune directory. Before we start our fine-tuning job, we need to create a kubernetes secret with a huggingface API token and accept the Google license to be able to download the model weights. Go to the google/gemma-2-9b and accept the license. Then run the commands below to create huggingface secret:
export HF_TOKEN=<HF_TOKEN>
kubectl create secret generic hf-secret \
    --from-literal=hf_api_token=${HF_TOKEN} \
    --dry-run=client -o yaml | kubectl apply -f -
Now we can use MLFlow to track our fine-tuning process as an MLFlow experiment. To do so, we will define several files:
cloudbuild.yamlto use build and push Docker image to Artifact RegistryDockerfilefor containerizationfinetune.yamlfile for GKE cluster jobfinetune.pyfor fine-tuning
After that, we can build our Docker image for a fine-tuning job. Run the command below:
gcloud builds submit .
In the end, the output should look like this:
DONE
-------------------------------------------------------------------------------------------------------------------------------------
ID                                    CREATE_TIME                DURATION  SOURCE                                                                                           IMAGES                                                                 STATUS
44ff24d5-042f-49e9-9666-5d00a6057e63  2025-01-14T09:45:13+00:00  12M43S    gs://akvelon-gke-aieco_cloudbuild/source/1736847911.742098-6bbf01cd346f41aeb96cdd0ceb658181.tgz  us-docker.pkg.dev/akvelon-gke-aieco/gemma/finetune-gemma-mlflow:1.0.0  SUCCESS
In the finetune.yaml file you can see environment variables:
MLFLOW_URI: for connecting to the MLFlow tracking server. We set it tohttp://mlflow:5000, which is an internal GKE cluster URI.MLFLOW_ARTIFACT_URI: for connecting experiments to our GCS bucket. You should specify it likegs://<BUCKET_NAME>/<ANY_EXISTING_PATH>.MLFLOW_EXPERIMENT_NAME: this is an experiment name. If you want to start a fine-tuning job as a new experiment, then change this variable.
Replace <PROJECT_ID> with your project ID in the finetune.yaml file and apply this manifest by running:
kubectl apply -f finetune.yaml
You can review your pods by running the following command.
kubectl get pods -w
After the status of your pod is Running, you can check the running logs via this command:
kubectl logs <POD_NAME> -f
After about 15 minutes you should be able to see fine-tuning logs. The output should look like this:
🏃 View run skillful-quail-419 at: http://mlflow:5000/#/experiments/1/runs/3e45c44cfbe94cdfac5039b86eb79c7a
🧪 View experiment at: http://mlflow:5000/#/experiments/1
Or you can go to your MLFlow and check metrics.The whole fine-tuning experiment should take about 26 minutes.
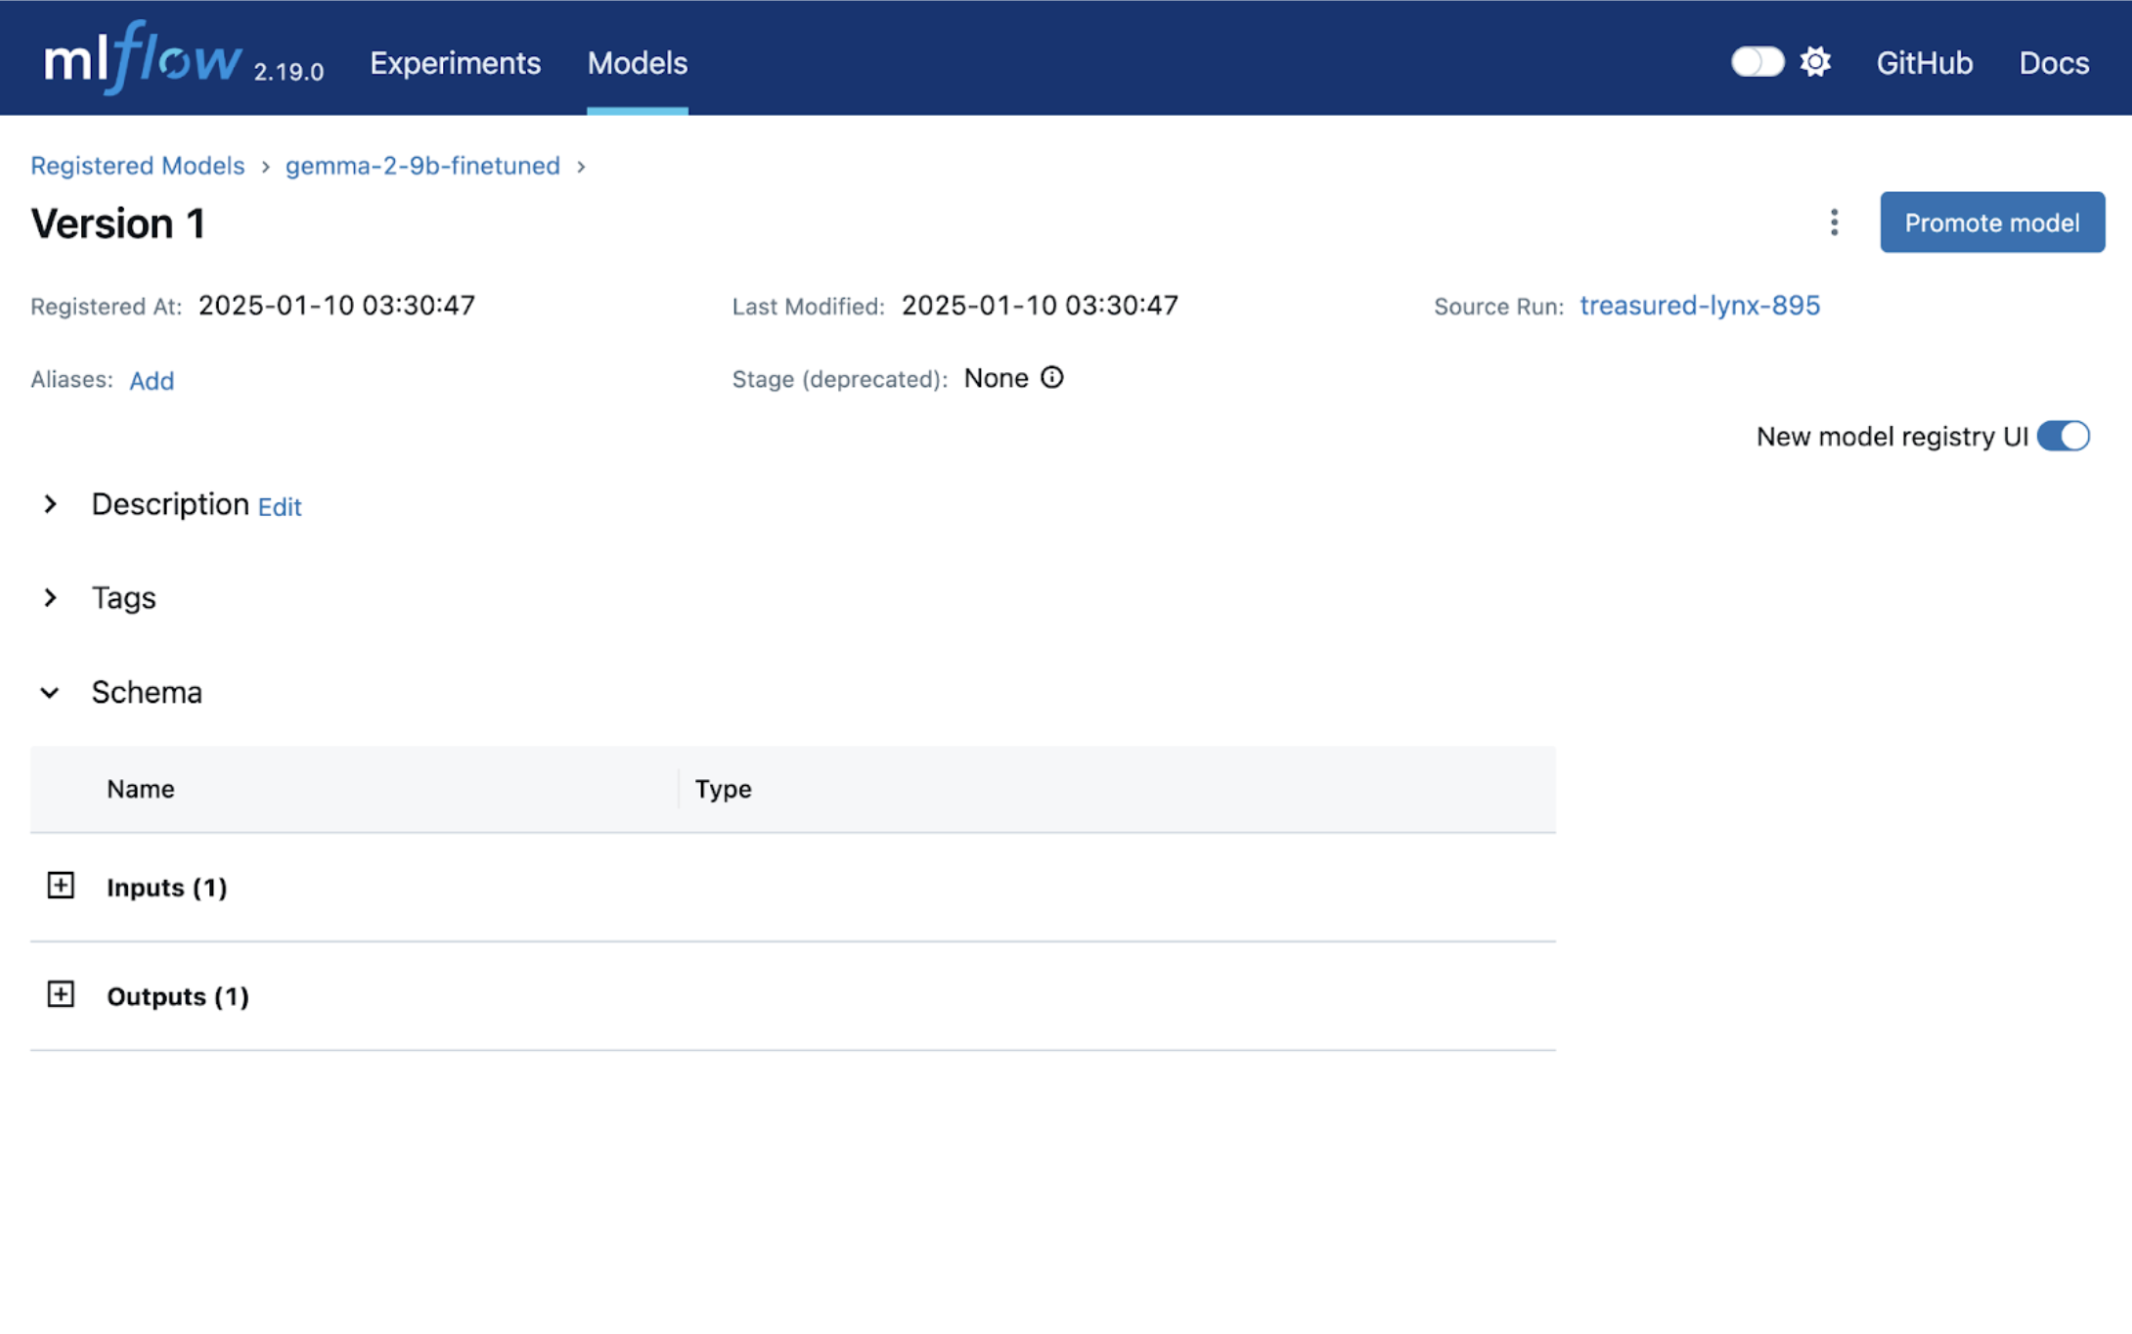
Model registry
After the fine-tuning job is finished, you can check the result in MLFlow UI.
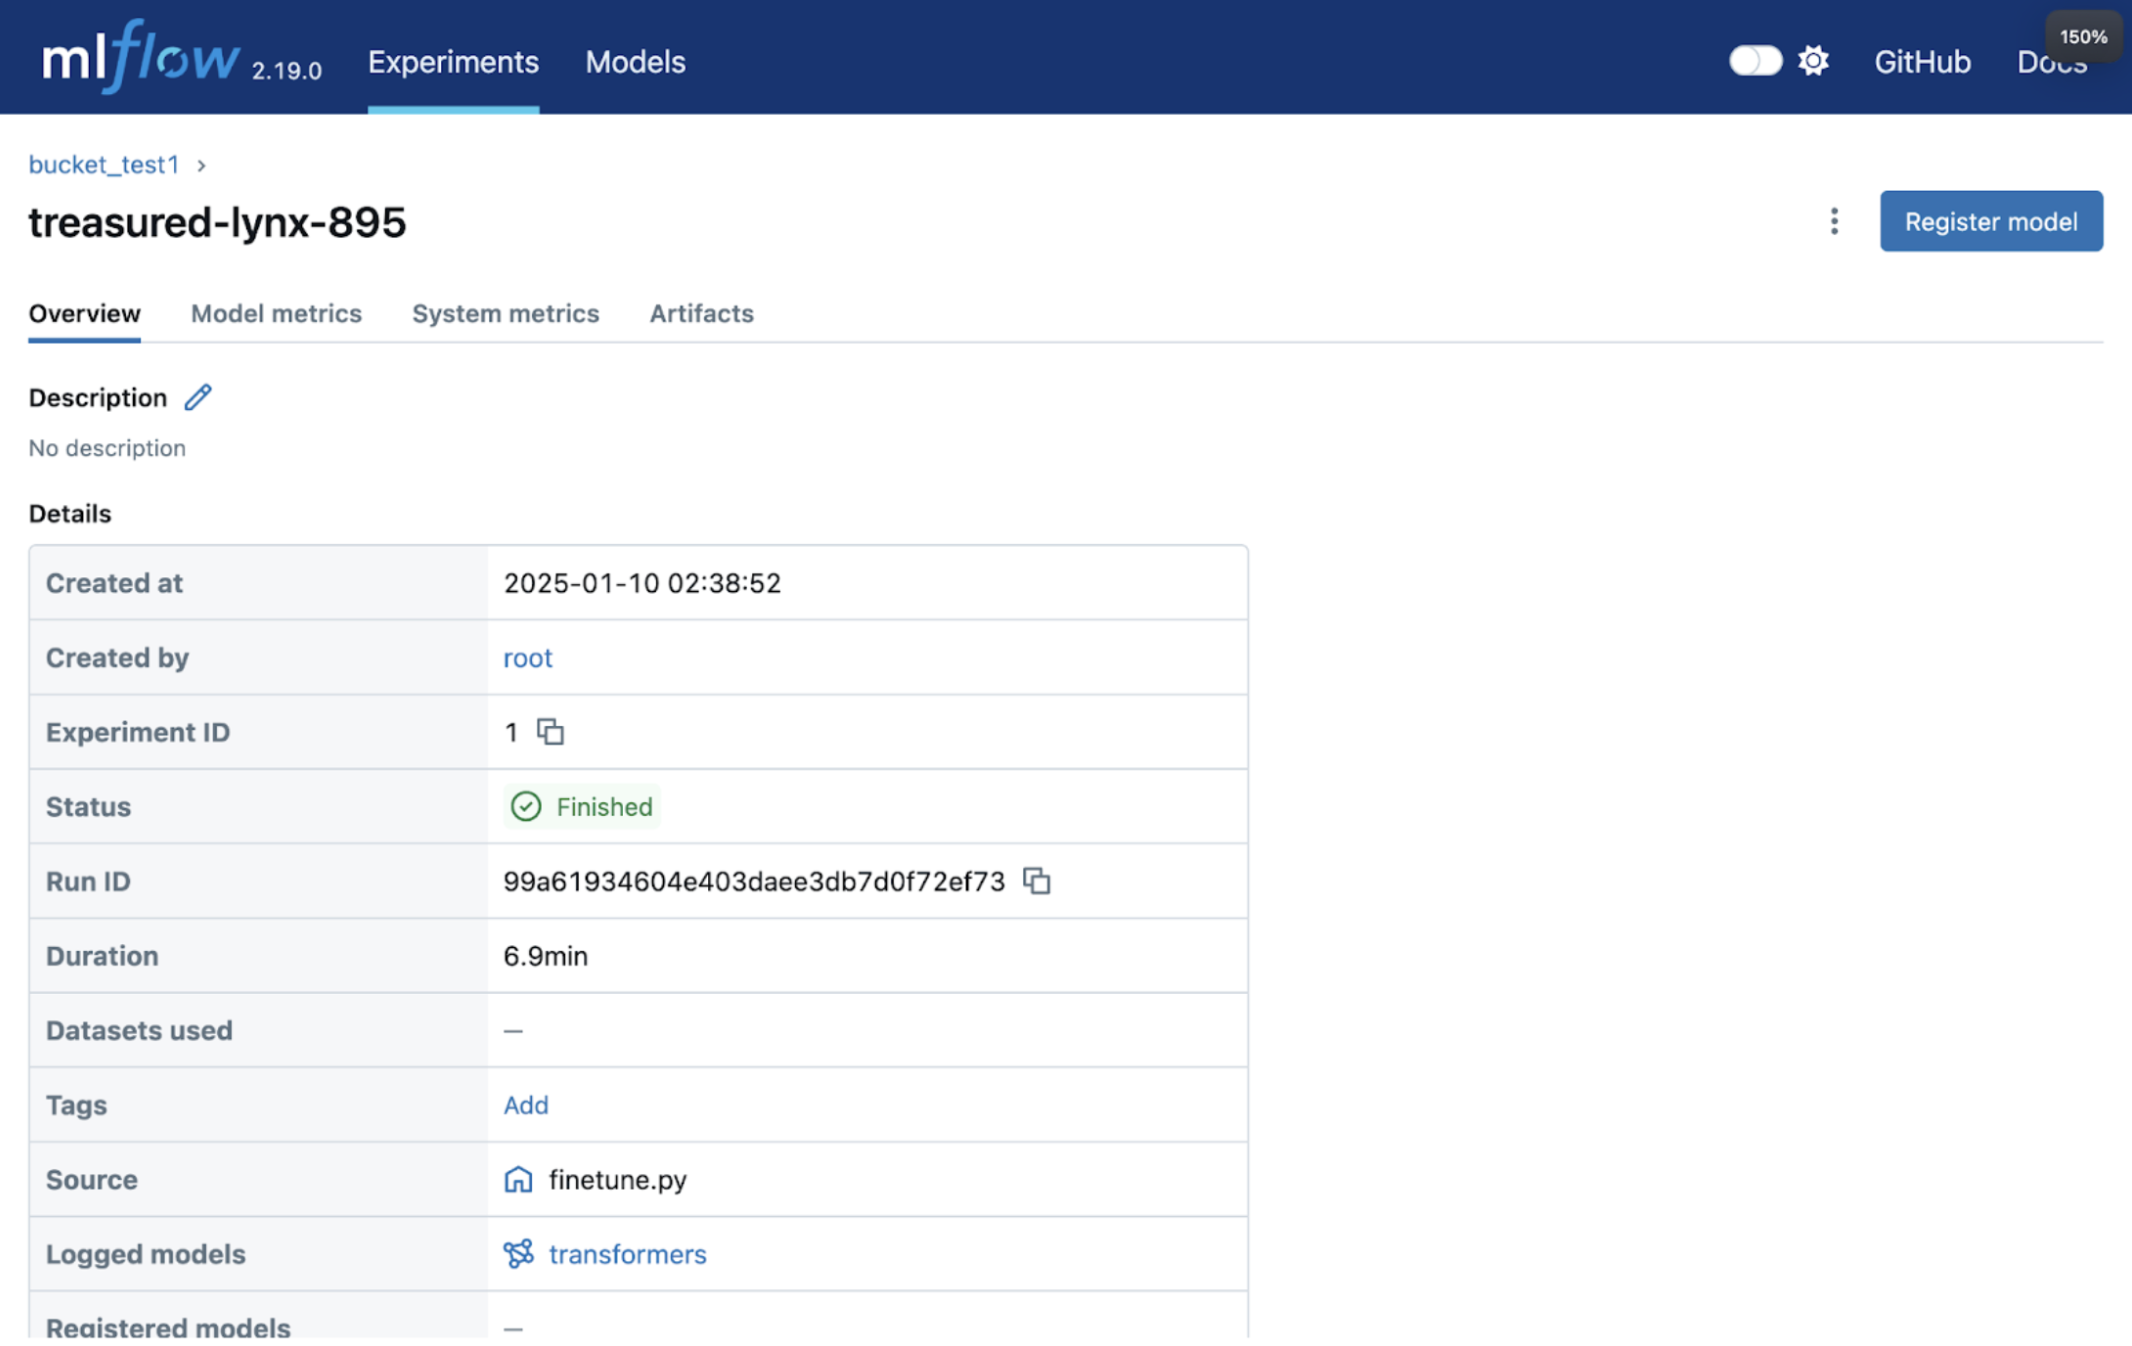
Find your experiment and go to the artifacts tab.
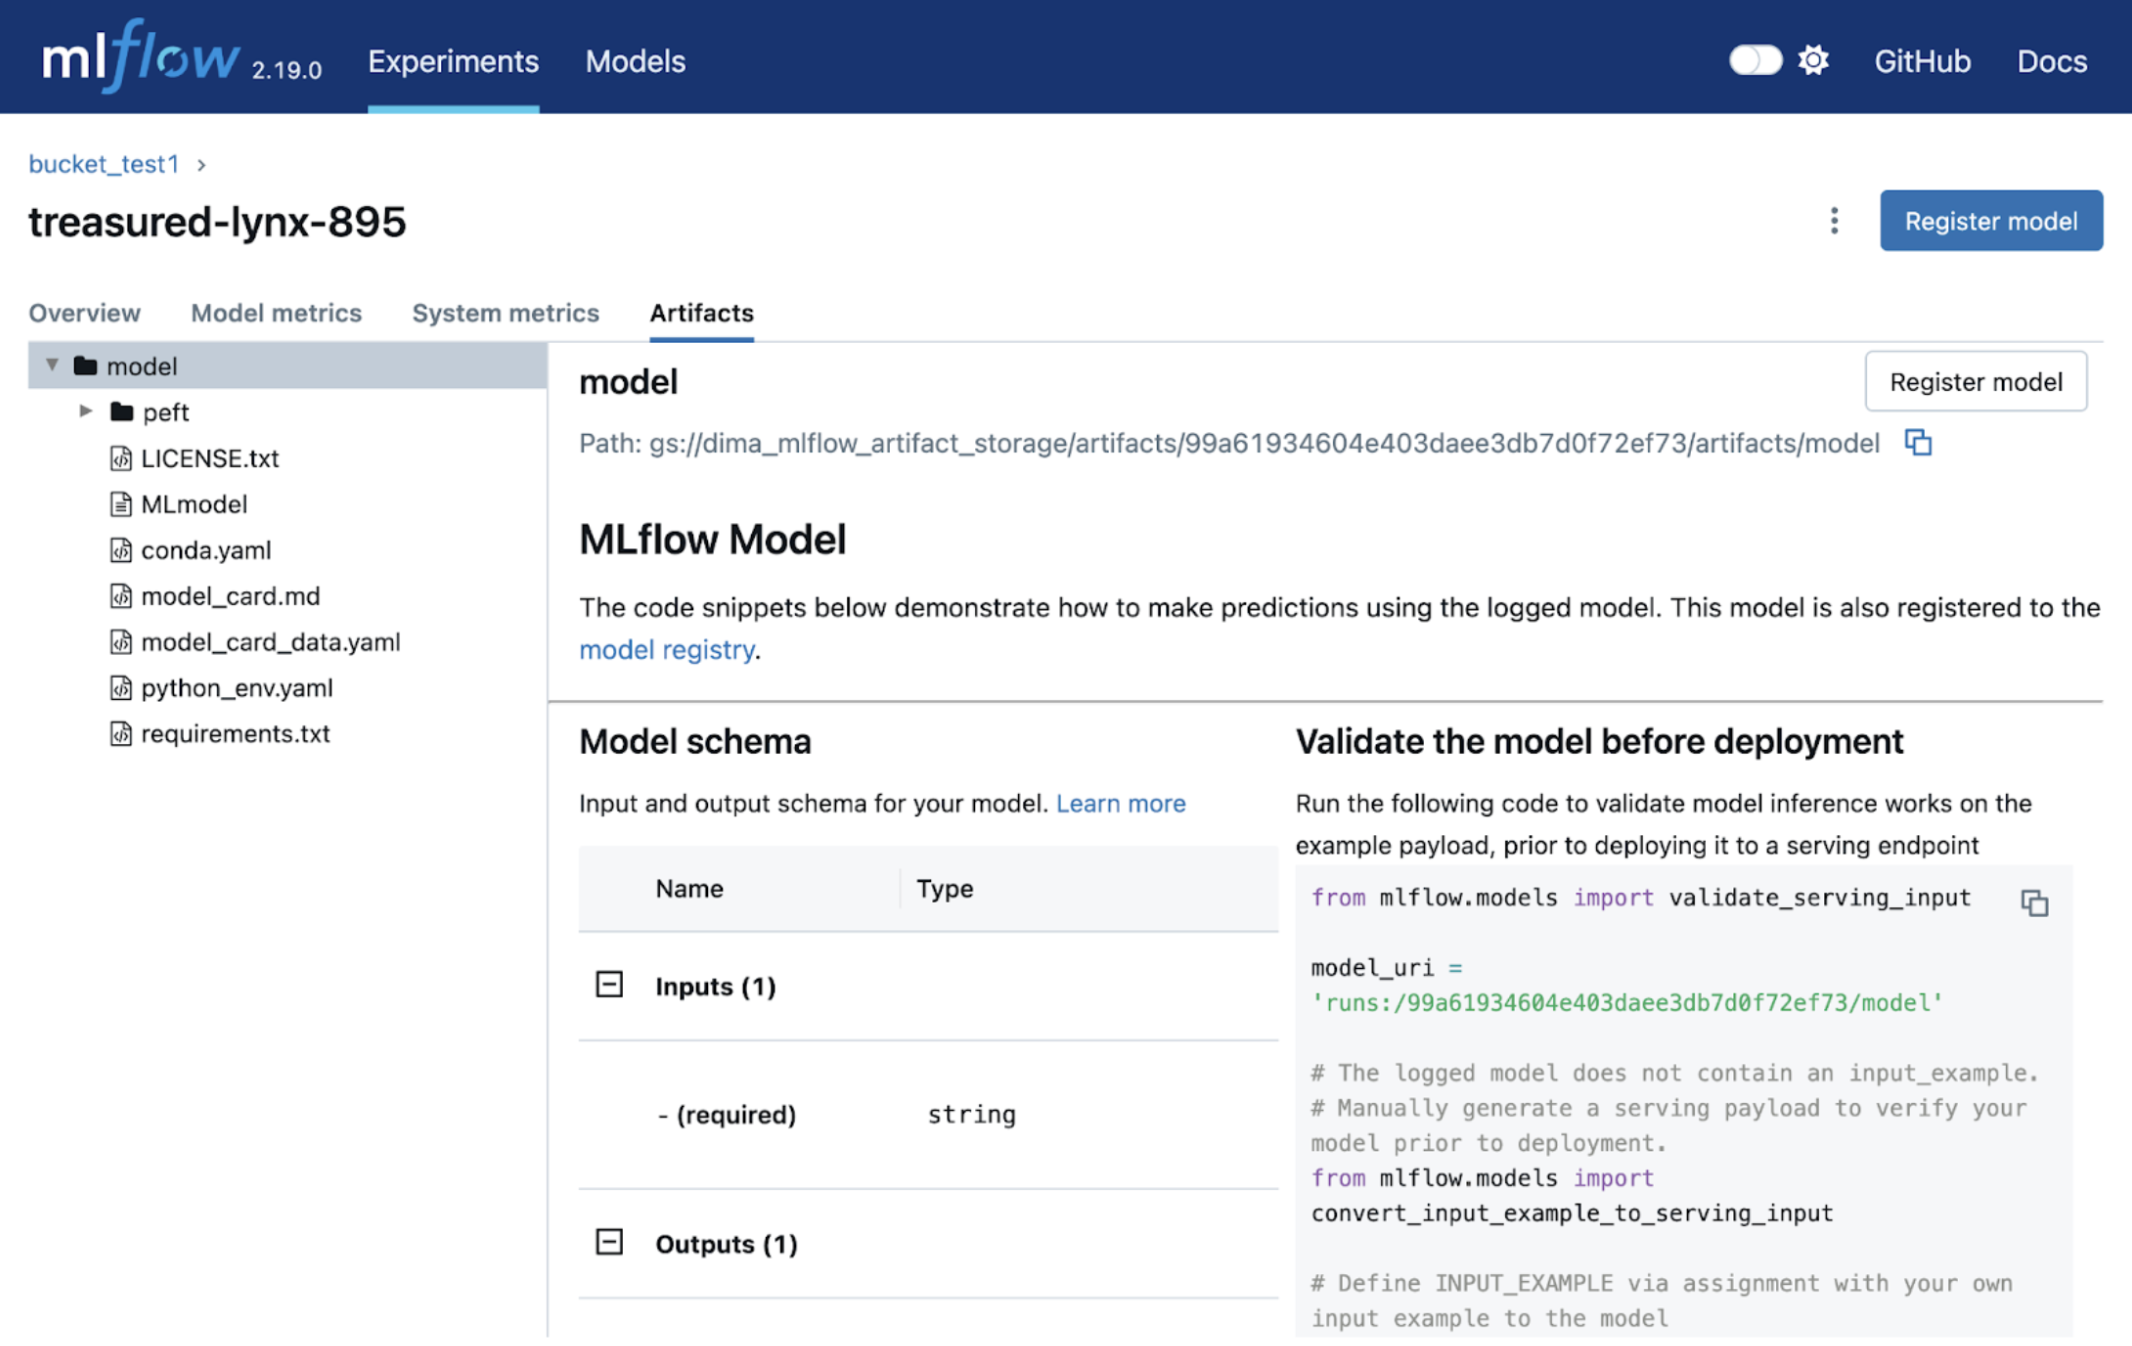
Here you can register your model.
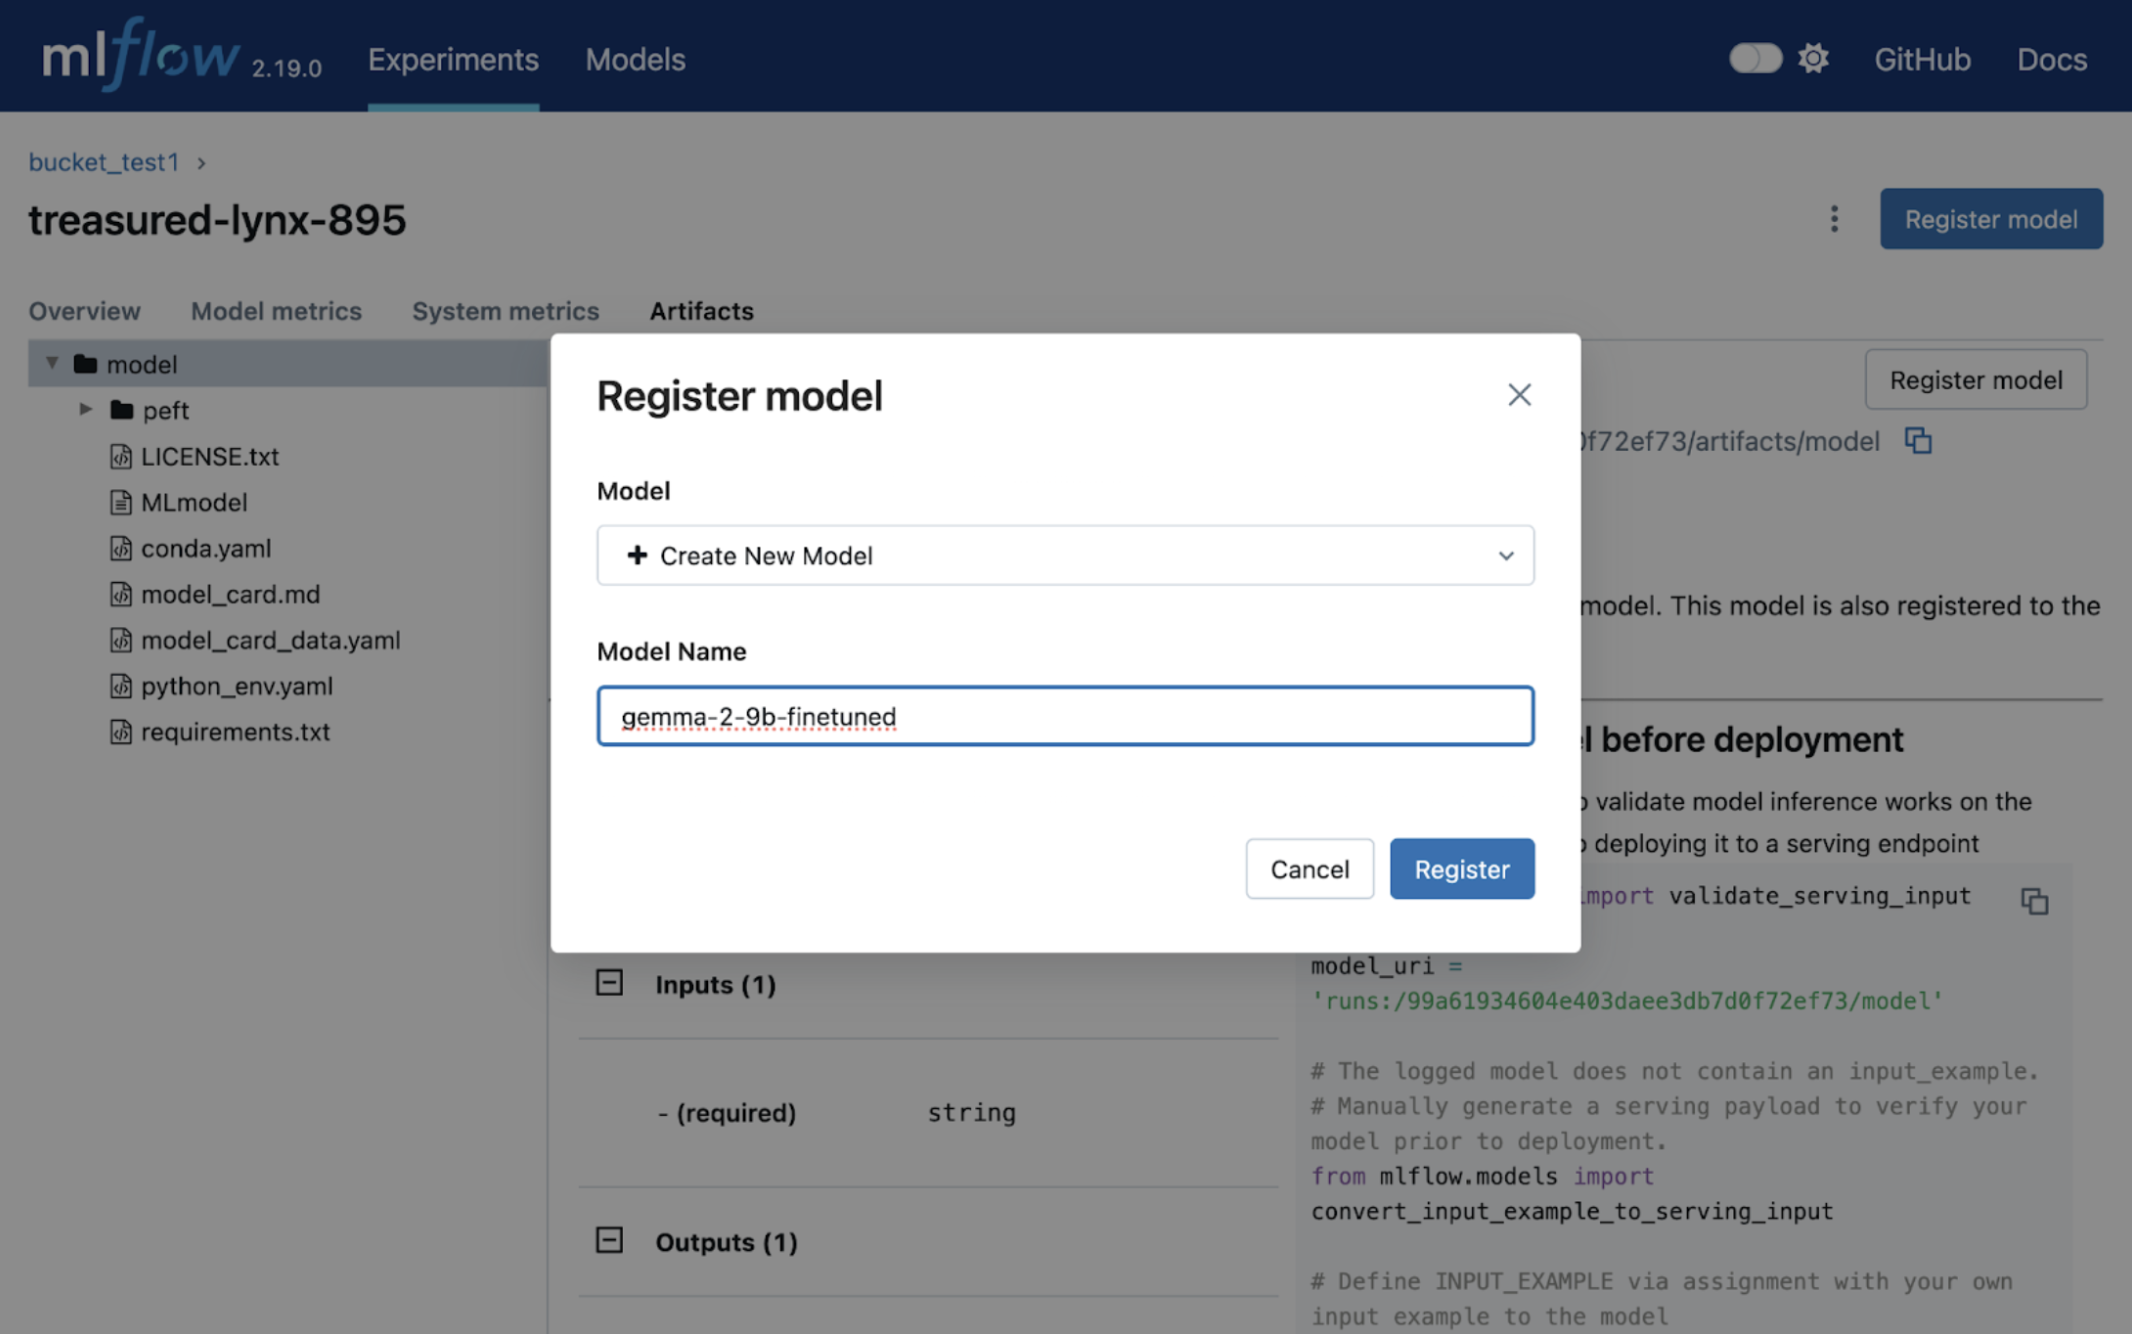
Now you have registered an ML model in MLFlow!
Deployment
In this section we have two subsections that describe a simple deployment and a production like. If you want to just check the model result, you should follow the Simple deployment section. If you want to deploy your fine-tuned model using KServe, follow the KServe deployment section.
Simple deployment
Go to the deploy-gemma2/simple directory. In this directory you can see the following files:
cloudbuild.yaml: helps us to create and submit a deployment Docker image.deploy.yaml: creates deployment and service to invoke our fine-tuned model.main.py: defines a simple FastAPI application with a single API endpointpredict.
Run this command to submit a deployment Docker image to your repository:
gcloud builds submit .
After the command is completed, edit the following variables in deploy.yaml file:
<PROJECT_ID>: your project ID.<YOUR_BUCKET_NAME>: your bucket where you store the fine-tuned model.<MLFLOW_RUN_ID>: the MLFLow experiments’s ID.
And run the following command to deploy the model:
kubectl apply -f deploy.yaml
To check status of your deployment, find your pod name by running kubectl get pods and then run this command to check the logs:
kubectl logs <POD_NAME> -f
You can consider your deployment seccessful and ready to use when your logs look like this:
Loading checkpoint shards: 100%|██████████| 35/35 [00:52<00:00,  1.49s/it]
INFO:     Started server process [1]
INFO:     Waiting for application startup.
INFO:     Application startup complete.
INFO:     Uvicorn running on http://0.0.0.0:11434 (Press CTRL+C to quit)
Run this command to forward the port for your service:
kubectl port-forward svc/gemma2-9b-finetuned-service 8081:11434
And go to the http://127.0.0.1:8081/docs. Here you should be able to invoke your model. For example, for input:
Question: What is the total number of attendees with age over 30 at kubecon "eu"?\nContext: CREATE TABLE attendees (name VARCHAR, age INTEGER, kubecon VARCHAR)\n\nAnswer:
The output should look like this:
SELECT COUNT(*) FROM attendees WHERE age > 30 AND kubecon = "eu"
KServe deployment
Go to the deploy-gemma2/kserve directory. In this section we will use KServe to deploy our fine-tuned model.
To install KServe, you can follow the guide in our repo. After the successful installation, we need to patch the deployment mode and create an ingress class. Run the command below:
kubectl patch configmap/inferenceservice-config -n kserve --type=strategic -p '{"data": {"deploy": "{\"defaultDeploymentMode\": \"RawDeployment\"}"}}'
The command above switches deployment mode from Serverless to RawDeployment, which bypasses Knative. RawDeployment mode directly manages Kubernetes resources for model deployment, which can offer more flexibility.
Also install the ingress class by running this command:
kubectl apply -f - <<EOF
apiVersion: networking.k8s.io/v1
kind: IngressClass
metadata:
  name: istio
spec:
  controller: istio.io/ingress-controller
EOF
We need this class to be able to invoke the deployed model.
Before deployment, we have to prepare the environment for the mlserver. Since seldonio/mlserver’s libraries might be outdated, we can provide our custom environment with libraries that we need (you can read more detail here).
You can see that we have a conda-configs directory. Inside this directory is a yaml file that will be used to create our custom environment. Create a configmap with this environment.yaml by running this command below:
kubectl create configmap conda-requirements --from-file=conda-configs
Before you run environment creation job, you need to adjust values in the create-tarball.yaml and deploy.yaml:
<YOUR_BUCKET_NAME>– you should paste your bucket name here.
Now we can run our environment creation job:
kubectl apply -f create-tarball.yaml
You can check the progress of the tarball creation by running the following command:
kubectl logs <POR_NAME> -f
After the job is done, you can see that your bucket now has mlflow-gemma2-env.tar.gz tarball. We will use it in the deploy.yaml.
Change the following variables in the deploy.yaml file:
<PATH_TO_YOUR_MODEL>– you can find the path in the MLFlow UI (it should look likegs://<BUCKET_NAME>/asdf12345/artifacts/model).<YOUR_BUCKET_NAME>– your bucket name that should be mounted via gcsfuse to install your conda environment.
Run the command below:
kubectl apply -f deploy.yaml
You can check deployment status by this command:
kubectl get inferenceservices -w
The output should look like this:
NAME                                  URL                                                              READY   PREV   LATEST   PREVROLLEDOUTREVISION   LATESTREADYREVISION   AGE
gemma-2-9b-finetuned                  http://gemma-2-9b-finetuned-default.example.com                  True                                                                  4m34s
When the inferenceservice gets the READY=True, you can invoke fine-tuned model using these commands below to access the model:
SERVICE_HOSTNAME=$(kubectl get inferenceservice gemma-2-9b-finetuned -o jsonpath='{.status.url}' | cut -d "/" -f 3)
INGRESS_HOST=127.0.0.1
INGRESS_PORT=8081
kubectl port-forward -n istio-system svc/istio-ingressgateway $INGRESS_PORT:80 &
And the model call command:
curl -v \
  -H "Host: ${SERVICE_HOSTNAME}" \
  -H "Content-Type: application/json" \
  -d @./input.json \
  http://${INGRESS_HOST}:${INGRESS_PORT}/v2/models/gemma-2-9b-finetuned/infer | jq
The output should be like this:
{
  "model_name": "gemma-2-9b-finetuned-1",
  "id": "d0d248ea-1b4b-42a0-bf96-14b95819daac",
  "parameters": {
    "content_type": "str"
  },
  "outputs": [
    {
      "name": "output-1",
      "shape": [
        1,
        1
      ],
      "datatype": "BYTES",
      "parameters": {
        "content_type": "str"
      },
      "data": [
        "SELECT COUNT(*) FROM attendees WHERE age > 30 AND kubecon = \"eu\""
      ]
    }
  ]
}
Clean up
To clean up, you need to go to the terraform-gke-cluster directory and run the following command:
terraform destroy -var-file=example_environment.tfvars
Feedback
Was this page helpful?
Thank you for your feedback.
Thank you for your feedback.